Athena
Behavioral
Tactical Fund
Overview
The Athena Behavioral Tactical Fund employs a tactical market rotation strategy that seeks to invest in the right market at the right time.
I Shares
-
ATVIX
Ticker -
1.53%
Net Expense Ratio -
2.59%
Gross Expense Ratio -
N/A
Maximum Sales Charge -
$100,000
Minimum Investment -
66538B388
CUSIP
Objective and Strategy
The Athena Behavioral Tactical Fund (the “Fund”) seeks capital appreciation.
The Fund utilizes patented behavioral market indicators to gauge and select broad market exposure among various equity markets, market capitalization, or cash each month. The Fund invests in positions within US small cap, US large cap, or international equities when market indicators are strong. When indicators are very strong, the Fund’s exposure can increase to twice the market to enhance returns. When indicators are weak, the Fund can move to 100% cash.
Tactical Tilt
Systematically deliver a tactical tilt to your overall portfolio to potentially make it more responsive to market conditions.
Market Rotation
Variable Exposure
Performance
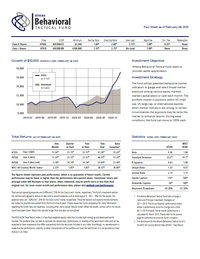
Growth of $10,000 (MARCH 11, 2019 – MAY 31, 2025)
Statistics (APR 2019 – MAY 2025)
| ATVIX | ACWI | |
|---|---|---|
| Beta | 0.89 | 1.00 |
| Standard Deviation | 23.0% | 16.3% |
| R-Squared | 0.40 | 1.00 |
| Sharpe Ratio | 0.17 | 0.69 |
| Sortino Ratio | 0.17 | 1.12 |
| Upside Capture | 84% | 100% |
| Downside Capture | 105% | 100% |
| Maximum Drawdown | -38.43% | -25.61% |
Total Returns
| One Month |
Year to Date |
One Year | Three Year |
Five Year |
Since Inception1 |
|
|---|---|---|---|---|---|---|
| ATVIX Class I (NAV) | 9.86% | -18.62% | -21.24% | -4.21% | 5.02% | 3.97% |
| MSCI All Country World Index2 | 5.75% | 5.32% | 13.65% | 12.30% | 13.37% | 11.36% |
Historical Performance
| One Year |
Three Year |
Five Year |
Since Inception3 |
|
|---|---|---|---|---|
| ATVIX Class I (NAV) | -23.53% | -8.08% | 6.32% | 2.86% |
| MSCI All Country World Index | 7.15% | 6.91% | 15.18% | 8.46% |
The figures shown represent past performance, which is no guarantee of future results. Current performance may be lower or higher than the performance data quoted above. Investment return and principal value will fluctuate so that shares, when redeemed, may be worth more or less than their original cost.
Total annual operating expense is 2.59% for Class I shares. The Fund’s investment advisor has contractually agreed to reduce its fees and/or absorb expenses until at least August 31, 2025. After this fee waiver, the expense ratio is 1.25% for Class I shares. These fee waivers and expense reimbursements are subject to possible recoupment from the Fund in future years. Please review the Fund’s prospectus for more information regarding the Fund’s fees and expenses, including other share classes. Results shown reflect the waiver, without which the results could have been lower. Returns for periods longer than one year are annualized.
The MSCI ACWI Total Return Index is a free-float weighted equity index that includes both emerging and developed world markets. The portfolio does not seek to replicate the composition, performance, or volatility of the benchmark index and can be expected to have investments that differ substantially from the securities included in any index. Accordingly, no representation is made that the performance, volatility, or other characteristics of the portfolio will track the benchmark. It is not possible to invest directly in an index.
Notes
- The Athena Behavioral Tactical Fund had a change in name and Principal Investment Strategies on 03/11/2019. The Since Inception performance shown on the Month End tab is performance since this change and is from 03/11/2019 onward. Partial month performance is calculated for March 2019.
- The benchmark for the Athena Behavioral Tactical Fund is the MSCI All Country World Index (ACWI) – Total Return.
- The Athena Behavioral Tactical Fund had a change in name and Principal Investment Strategies on 03/11/2019. The Since Inception performance shown on the Quarter End tab is performance since the Fund’s inception on 05/15/2015. Returns for periods longer than one year are annualized.
Literature
Marketing
Reports
Annual Reports
-
Annual Report (April 30, 2024)
-
Annual TSR (April 30, 2025)
-
Semi-Annual Report (October 31, 2024)
-
Semi-Annual TSR (October 31, 2024)
Portfolio Reports
Proxy Voting Reports
Purchase
How to Invest
The fund is available for purchase on most major retail brokerage platforms or you can open an account directly with the fund. Please use the forms available here.
Taxable Accounts
Qualified Accounts
Investors should carefully consider the investment objectives, risks, charges, and expenses of the Athena Behavioral Tactical Fund. This and other important information about the Fund is contained in the Prospectus, which can be obtained by contacting your financial advisor or by calling (888) 868-9501. The Prospectus should be read carefully before investing. The Athena Behavioral Tactical Fund is distributed by Northern Lights Distributors, LLC member FINRA/SIPC. AthenaInvest Advisors LLC and Northern Lights Distributors, LLC are not affiliated. Mutual Funds involve risk including the possible loss of principal.
20250605-4552665

